- nodes in the network need to be partition-able in the two classes of nodes. For example, they should have an attribute with 2 different values to represent each of the class.
- filter the network (using the partition filter) to display just one class of nodes.
- apply the alphabetical sorter layout.
- unfilter, now filter the other class of nodes (again, using the partition layout).
- apply the alphabetical sorter layout, with paramters adjusted so that the new class of nodes gets positioned on the left or right of the first class of nodes.
Issues: for more than a hundred of nodes in each class, and lots of edges (1,000 or so), the graph remains cluttered. Other viz strategies are needed then, that remain to be invented.
Statistics:Posted by seinecle — 09 Oct 2013 13:28
]]>
You can manipulate the positioning of specific nodes with the Geolayout. You can download it with Tools -> Plugin. Use it to give particular coordinates to your predators (say, arrange them on a certain latitude), and other coordinates to the preys (say, on a different latitude). Use longitude to express another attribute (frequency of capture, protein intake or whatever is relevant in your data!)
Another and quicker solution would work if you have a small network: "fix" your predators (or preys...) by right-clicking on them and select "settle". Then, apply the Force Atlas layout (or any other of your choice), and your predators will remain in position, while the preys will be rearranged according to the logic of the layout. Play with the position of your predators until you get a satisfying result.
These are second best solutions, but I hope they might help. Do not hesitate to send me a private email if you want to discuss more about these solutions.
Finally, I'd suggest you to have a look at ORA (developed at Carnegie Mellon, part of the CASOS (sic) package: http://www.casos.cs.cmu.edu/projects/ora/
This free software has some capabilities for the display and analysis of bipartite (and n-partite) networks. But the visualizations are simply not on par with those of Gephi...
Best,
Clement
Statistics:Posted by seinecle — 14 May 2011 17:38
]]>
Artem
Statistics:Posted by a.oboturov — 06 May 2011 01:18
]]>
Arguably, this would call for a dedicated approach. The same way "directed / undirected" is thought about in the definition of the gexf format and Gephi features, in a perfect world, the same work would be done for simple / bipartite graphs. What are the developers of Gephi thinking about that?
I dont'think Bipartite (pr N-partite) are at the same level as directed/undirected, but yes they need dedicated tools and algorithms.Statistics:Posted by mbastian — 04 May 2011 15:58
]]>
Statistics:Posted by admin — 04 May 2011 14:56
]]>
Statistics:Posted by TomAug85 — 03 May 2011 11:16
]]>
Statistics:Posted by a.oboturov — 02 May 2011 18:50
]]>
From your text, it seems that the geo-layout plugin could be used to manipulate the position of the nodes according to the set they belong to.
But I jump in on a related issue: bipartite graphs call for different metrics (of centrality, clusterization, etc.) and types of manipulations (one could want to filter on one set of nodes, not on the other, or have just one set which is dynamic, while the other would remain static, etc.).
Arguably, this would call for a dedicated approach. The same way "directed / undirected" is thought about in the definition of the gexf format and Gephi features, in a perfect world, the same work would be done for simple / bipartite graphs. What are the developers of Gephi thinking about that?
Best,
Clement
Statistics:Posted by seinecle — 29 Apr 2011 08:10
]]>
]]>
A bipartite graph represents the interactions between two node classes, usually predator-prey, pollinator-plant, or individual and roost/nest site.
I'm new to these forums so sorry for any newbie errors.
A standard network of this type may look like this in a force atlas layout:
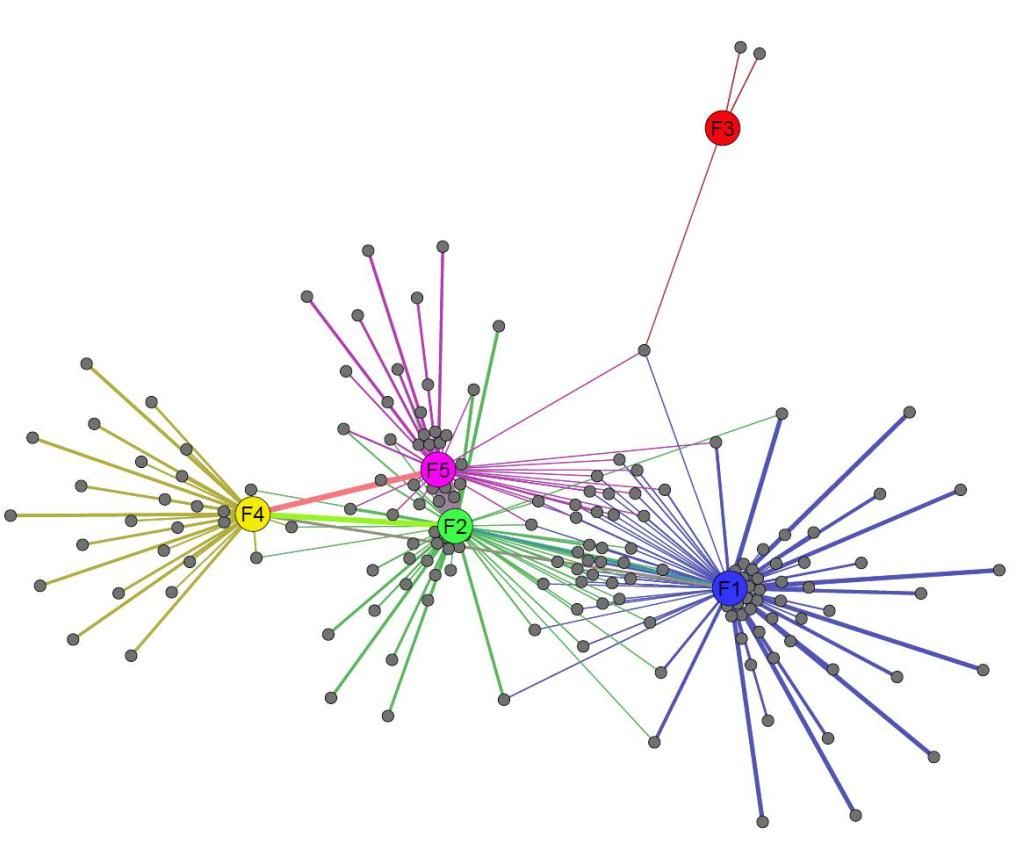
There are two classes of node in this network, those that are grey and those with colour. You could think of the grey nodes as bees and the coloured nodes as different plants they forage at or humans and bars they drink at (please ignore the lines between the coloured nodes for this example)
To make better sense of this these types of network should be displayed like this:
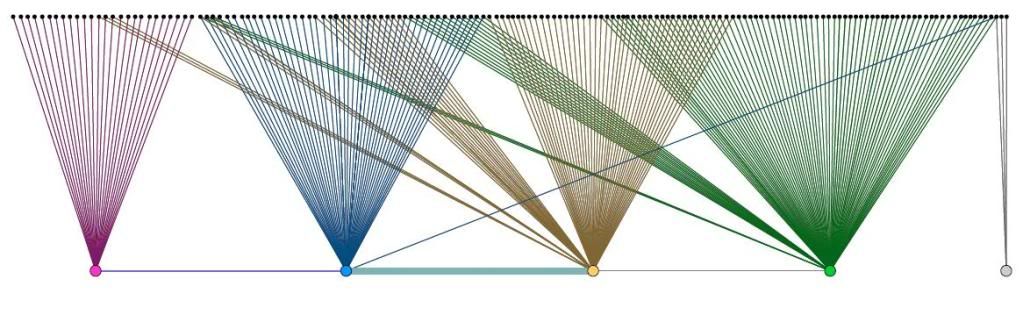
Here the same nodes are represented but in a two-tiered format that is easier to interpret. I did this one by hand. The nodes of each class need to be restricted to specific y-coordinates and then to be distributed uniformly along the x-axis. Nodes from the higher tier with similar connections to the lower tier should be placed close to each other.
Thoughts/questions welcome
EDIT: I tried to get the images to work... kinda got some of it!
Statistics:Posted by TomAug85 — 28 Apr 2011 16:38
]]>