A bipartite graph represents the interactions between two node classes, usually predator-prey, pollinator-plant, or individual and roost/nest site.
I'm new to these forums so sorry for any newbie errors.
A standard network of this type may look like this in a force atlas layout:
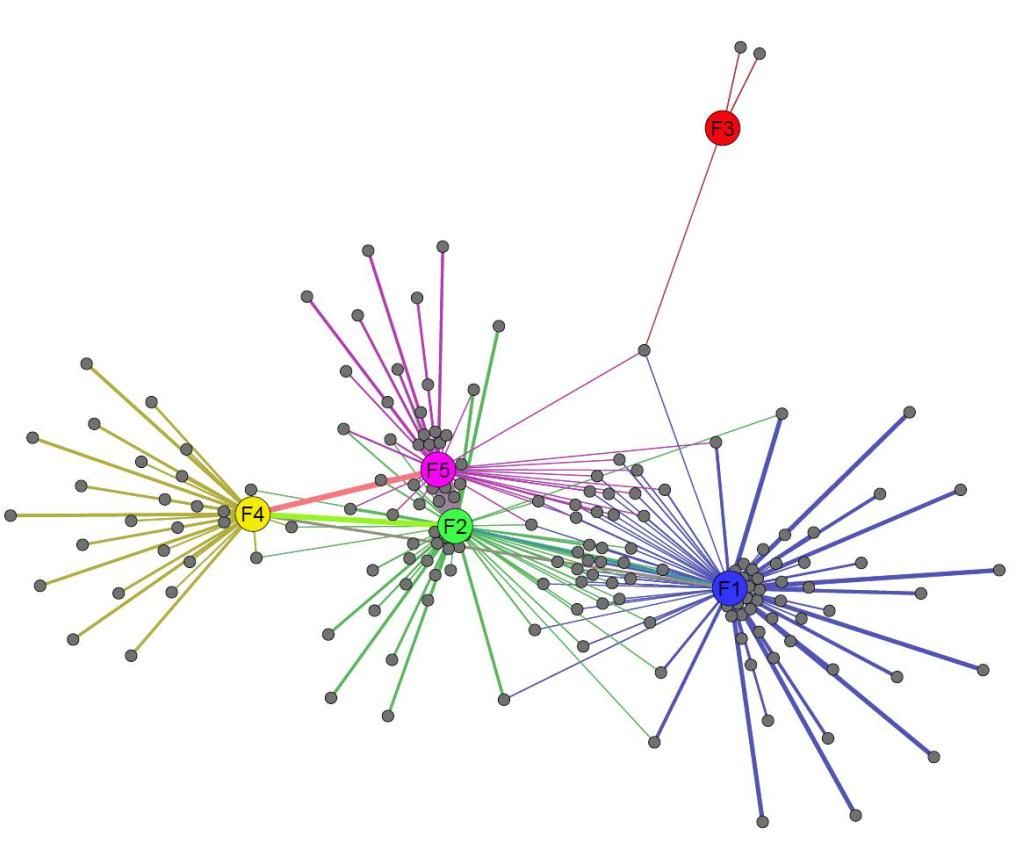
There are two classes of node in this network, those that are grey and those with colour. You could think of the grey nodes as bees and the coloured nodes as different plants they forage at or humans and bars they drink at (please ignore the lines between the coloured nodes for this example)
To make better sense of this these types of network should be displayed like this:
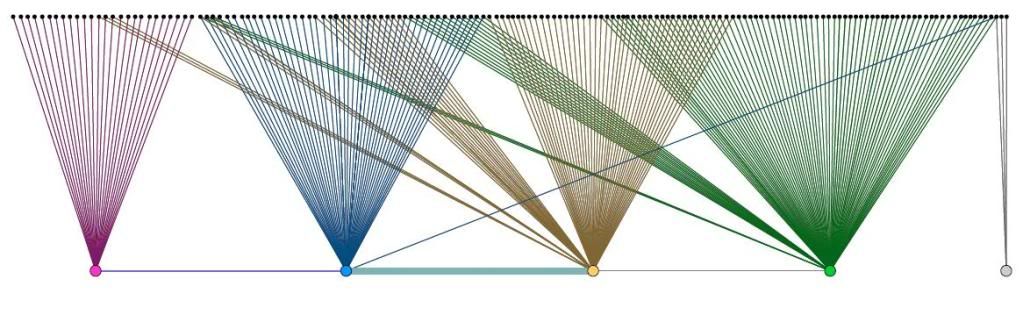
Here the same nodes are represented but in a two-tiered format that is easier to interpret. I did this one by hand. The nodes of each class need to be restricted to specific y-coordinates and then to be distributed uniformly along the x-axis. Nodes from the higher tier with similar connections to the lower tier should be placed close to each other.
Thoughts/questions welcome
EDIT: I tried to get the images to work... kinda got some of it!


